


Download the article in pdf format
Publication date: 01.04.2022
DOI: 10.51871/2782-6570_2022_01_01_8
UDC 796; 612
METHODOLOGICAL APPROACHES OF GLYCEMIC CONTROL IN SPORTS PRACTICE BASED ON CONTINUOUS GLUCOSE MONITORING DATA
A.Yu. Khrebtova1, E.V. Bуkov1, A.I. Kuzin2, O.V. Kamerer2
1Ural State University of Physical Culture, Chelyabinsk, Russia
2Advanced Professional Education Institute, South Ural State Medical University, Chelyabinsk, Russia
Annotation. The innovative continuous glucose monitoring method over a long period of time based on the flash monitoring ecosystem is a more effective and accurate method of predicting the glycemic response compared to traditional methods. In clinical practice, such devices are used actively in acute and long-term complications of type 1 and type 2 diabetes mellitus management and prevention. Assessment of glycemic variability – the most important component of glycemic control – may be of great scientific and practical interest in the context of evaluating metabolic strategies of glucose homeostasis in a group of people who need increased intake of carbohydrates. Athletes are a group of people who traditionally use hyperglycemic diets in order to develop indicators of speed and strength endurance against the background of glycolytic loads. A comparative analysis of glycemic variability parameters in individuals with different levels of physical activity compared with healthy individuals of the Caucasian race revealed a significant increase in the average values of glucose excursions exceeding modulo one standard deviation in the group of athletes (Mann-Whitney U-test, p=0.022). A study of continuous glucose monitoring indicators using the FreeStyle Libre glycemia flash monitoring system made it possible to track the presence of personalized glycemic portraits in healthy volunteers reflecting the strategy of blood glucose homeostasis within a lifestyle with different levels of physical activity. Analysis of the percentage of time intervals of being in a state of hyper-, normo- and hypoglycemia in participants revealed significant quantitative differences. The minimal time interval in the range of euglycemia (66%) was observed in a female “non-athlete” with the lowest level of physical activity. The minimal time interval in hyper- (15%) and hypoglycemia (1%) was recorded in an active athlete, who is in the transition period during a one-year training cycle. Methodically grounded use of continuous glucose monitoring in sports practice can become a tool for effective assessment of the power and capacity of the glucose homeostasis system and personalized correction of glycemic status using various lifestyle-modifying strategies.
Keywords: continuous glucose monitoring, glycemic variability, clinical ranges of normoglycemia, glucose homeostasis, individuals with various indicators of physical activity, glycemic control in sports practice.
Introduction. Continuous glucose monitoring (CGM) is one of the main tools of glycemic control, including evaluation of the glycemic variability (GV) and time ranges (TR) of normo-, hypo- and hyperglycemia, which is used in patients with the type 1 and 2 diabetes mellitus (DM) [1]. Within the clinical practice, CGM is used for assessing quality of glycemic control, predicting hyper- and hypoglycemia, as well as DM’s vascular complications [2-4]. Variability of daily blood glucose indicators was thoroughly studied within a group of individuals with the type 1 and 2 diabetes, which increased the efficiency of glucose-lowering therapy significantly.
Currently there are no generally accepted reference values of TR and GV in healthy people that allow to differentiate normal (physiological) and excessive glucose fluctuations. In particular, the World Health Organization (WHO) defines normal glycemia as an empty stomach glucose level of less than 6.1 mmol/L. The organization recommends that the glucose level should be less than 7.8 mmol/L, 2 hours after the glucose tolerance oral test with 75 g of glucose [5]. The American Diabetic Association considers individuals with the level of 5.6-6.9 mmol/L on an empty stomach and the blood glucose (BG) level of less than >7.8-11.0 mmol/L after the oral test as a group with the increased risk of diabetes [6]. However, as the WHO explains in their recommendations, there is no final threshold of “normoglycemia”. Therefore, an issue of evaluating GV, based on CGM of healthy people is still under study. Studies of glycemia with the CGM method in healthy individuals are random and not systemic.
The search in the PubMed/MEDLINE and Cochrane databases revealed only one publication related to studies of normal reference ranges in average glucose level with the CGM method in healthy patients within different ethnic groups [7]. The Russian scientific database eLibrary (https://www.elibrary.ru/) also has few publications dedicated to research of GM according to the CGM data in individuals with normal tolerance to glucose [8].
Small invasiveness of the daily CGM method gives an opportunity to examine GV indicators in various groups of healthy people. Within foreign literature, there is only one publication dedicated to research of these indicators in athletes. There are no publications on this issue in the domestic scientific literature [9]. It is obvious that athletes are the most vulnerable group of people, who endure high loads of carbohydrate metabolism’s pathways. Glycolytic mechanisms of energy support and their power contribute significantly to the effect of competitive activity in sports requiring maximal manifestation of speed and strength endurance. A possibility to develop this mechanism depends on factors that define glucose homeostasis and its accessibility as an oxidation substrate within the process of muscle activity.
The important point is that athletes are recommended to eat products with high carbohydrate content to ensure adequate glycogen supply and increase athletic performance [10-11]. It is known that physical training improves sensibility of tissues to insulin immediately before training and at the expense of the long-term adaptation of glucose transportation and metabolism mechanisms [12]. However, it is also known that loaded exercises increase concentration of circulating catecholamines, such as adrenaline and noradrenalin, to pathological levels [13-14], which leads to hypo-, hyperinsulinemia after intensive exercises [15-16].
Therefore, the aforementioned data evidence the practical significance of evaluating the glycemic state in individuals, engaged in sports, over a long period of time.
The purpose of this study was to evaluate capabilities of existing methodological approaches of glycemic control in healthy people with different levels of physical activity.
The study’s main tasks are:
- Compare indicators of intra-day and inter-day variability, frequency and time characteristics of the glycemic profile in the group of healthy volunteers with the group of people of the Caucasian race without type 1 and 2 diabetes.
- Reveal features of glycemic indices of athletes compared to non-athletes.
Methods and organization. The study involved four healthy individuals of both genders. They led an ordinary lifestyle and did not receive adapted nutrition programs. Male athletes of sub elite level: athlete 1 – heart rate (HR) at rest <60 beats/min, 2 low-intensity training sessions per week, average number of steps per day – 9.5 thousand; athlete 2 – HR at rest <56 beats/min, 4-5 training sessions per week, 11 thousand steps per day in average. Two healthy volunteers, not engaged in sports: non-athlete 1 – a woman, HR at rest <62 beats/min, sedentary lifestyle, occupation – musician, 4 thousand steps per week; non-athlete 2 – a young man, HR at rest <68 beats/min, active lifestyle, 3 fitness training sessions of average intensity per week, 12 thousand steps per day. All participants were selected in accordance with the informed written consent for research of the optimal nutrition of individuals characterized with normal indicators of glycemia. Table 1 presents general characteristics of the examined group.
Table 1
Description of the study’s participants
|
The study’s participants |
athlete 1 |
athlete 2 |
non-athlete 1 |
non-athlete 2 |
|
Physical activity level (c.u.) |
1,9 |
2,2 |
1,4 |
2,1 |
|
Age (full years) |
20 |
20 |
24 |
12 |
|
Gender (m/f) |
m |
m |
f |
m |
|
Height (cm) |
178 |
181 |
164 |
154 |
|
Weight (kg) |
61.9 |
78 |
74.8 |
40.7 |
|
Body mass index (kg/m2) |
19.5 |
23.8 |
27.8 |
17.2 |
|
Abdominal circumference (cm) |
67.2 |
79.9 |
85.4 |
60.1 |
|
Chosen sports |
soccer |
soccer |
none |
swimming |
|
Sports mastery rank (age-group class) |
1 adult |
Candidate for master of sports |
none |
1 youth |
|
Athletic experience (years) |
13.5 |
14 |
0 |
8 |
The anthropometric indicators and values of the body mass index (BMI) were obtained with the biological impedance technique on the Accuniq BC 300 multifrequent body composition analyzer (Accuniq, South Korea, 2017).
In order to identify the physical activity (PA) level in each participant, we evaluated following lifestyle parameters: level of professional motor activity, average amount of steps per day and a number of training sessions or outdoor activities per week [17]. To count the average amount of steps per day in the course of 14 days, we applied the cross-platform fitness app for smartphones called “Pedometer, step counter Health” (Health and Fitness Apps Group, Republic of Belarus, 2021).
To evaluate GV in healthy volunteers in “natural” life conditions, we used the FreeStyle Libre ecosystem (Abbot, USA, 2018). This technology incudes the flash sensor that allows carrying out a continuous round-the-clock glucose monitoring for 14 days, the FreeStyle LibreLink app for smartphones and the LibreView 5 software – a free cloud system with web interface. The approach of evaluating the glycemic profile in 10 key indicators (table 2) [18] was tested and is successfully used for patients with type 1 and 2 diabetes. The International Consensus of Endocrinologists accepted these recommendations in 2019 [19].
Table 2
Key indicators of glycemic control and prediction of risks of long-term complications, based on CGM
|
1. Number of days for carrying out continuous glycemia monitoring |
14 days recommended |
|
2. Time share (%), within which the data were scanned |
≥70% and more for 14 days |
|
3. Mean glucose value (mmol/L) |
4.1–6.1 |
|
4. Indicator of glycemic control (%) |
<6.5 |
|
5. Glycemic variability (%) |
<36 |
|
6. Time above the range >13.9 mmol/L |
2 level |
|
7. Time above the range 10.1–13.9 mmol/L |
1 level |
|
8. Time within the range 3.9–10.0 mmol/L |
Range |
|
9. Time below the range 3.0–3.8 mmol/L |
1 level |
|
10. Time below the range <3.0 mmol/L |
2 level |
The GV assessment (range and frequency of fluctuations, time structure) was conducted on the basis of “raw” data from the CGM curve with the EasyGV © software, version 9.0 (available free for non-commercial use on www.easygv.co.uk). We examined following GV parameters as main indicators: M – mean glucose; SD – standard deviation of glucose level, a degree of glycemia dispersion; CONGA – continuous overlapping net glucose index, a value of dispersion in the difference of glycemic values (in absolute values) within the 60 minute interval during the whole period of monitoring; LI – lability index, indicates risks of hypoglycemic states; index J – quality indicator of glycemic control; LBGI – low blood glucose index; HBGI – high blood glucose index; MAGE – mean amplitude of glycemic excursions, during calculation all fluctuations with the amplitude of less than 1 SD are ignored; MAG – mean absolute glucose, allows assessing the ratio of glycemic fluctuations’ amplitude to time; ADRR – average daily risk range, a highly sensitive tool for evaluating total risks of hypo- and hyperglycemia and identifying people with high glycemic lability; MODD – mean of daily differences, a parameter of assessing inter-day glycemic fluctuations; GRADE – glycemic risk assessment diabetes equation. Figure 1 shows the algorhythm of calculating GV parameters with the EasyGV software.

Fig. 1. Mathematical model of evaluating glycemic variability in the Easy glycemic variability (GV) software
Note: graphic image of calculating 10 parameters of GV evaluation, based on the data from the CGM curve within 14 days
Arrangement of source information and visual presentation of results obtained were made in the form of Microsoft Excel 2016 tables. The statistical analysis was conducted with STATISTICA 10 (StatSoft.Inc), EasyGB, version 9 (the calculator was developed by the Oxford University Research Group, free access). Values were deemed as statistically significant if p<0,05.
Results and discussion. The outpatient glycemic profile (OGP) report is presented for each participant (fig. 2-5).
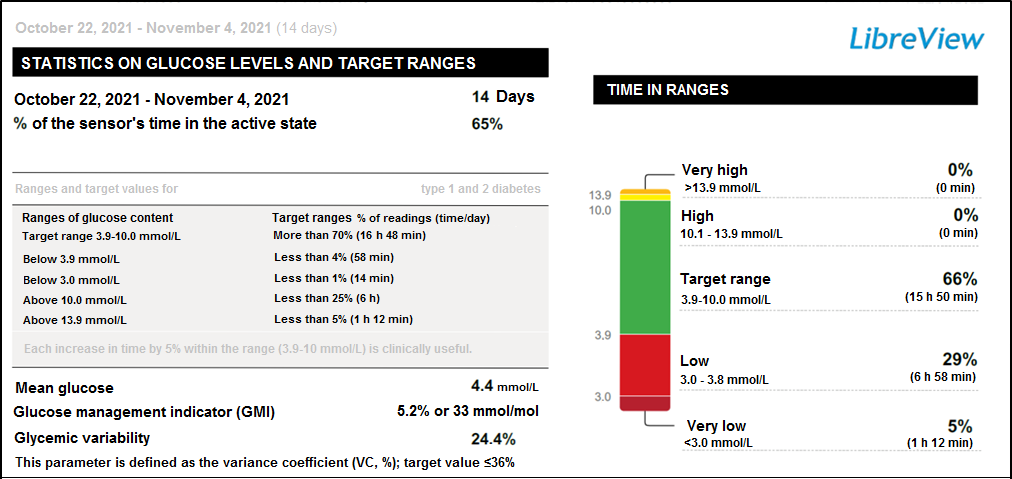
Fig. 2. OGP report, a woman, non-athlete, 24 years
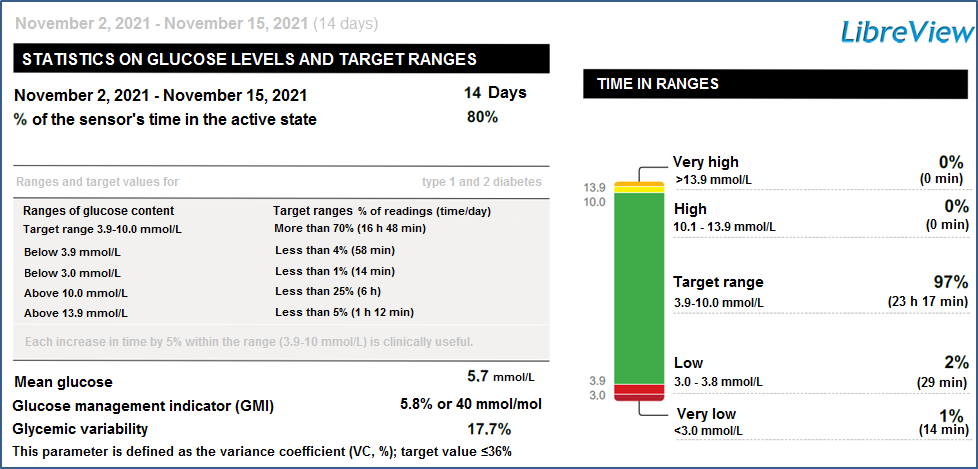
Fig. 3. OGP report, a young man, non-athlete, 12 years
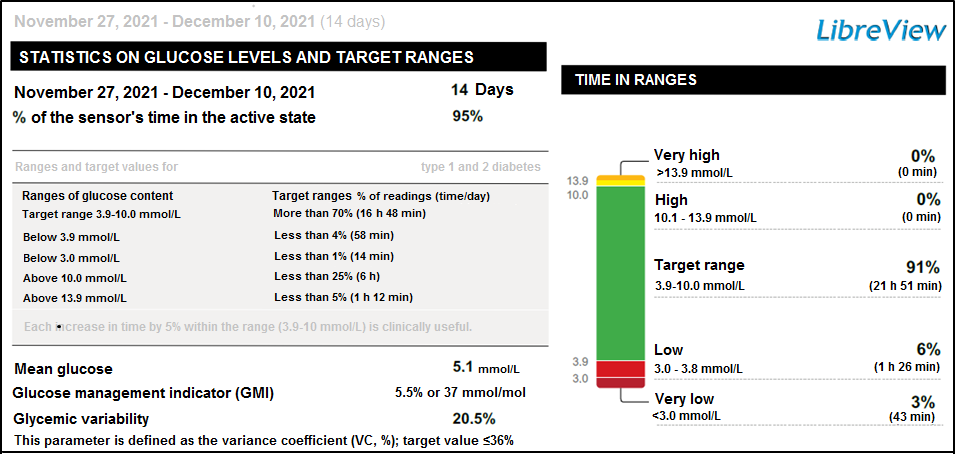
Fig. 4. OGP report, a man, athlete (more than 6 years out of the training process), 20 years
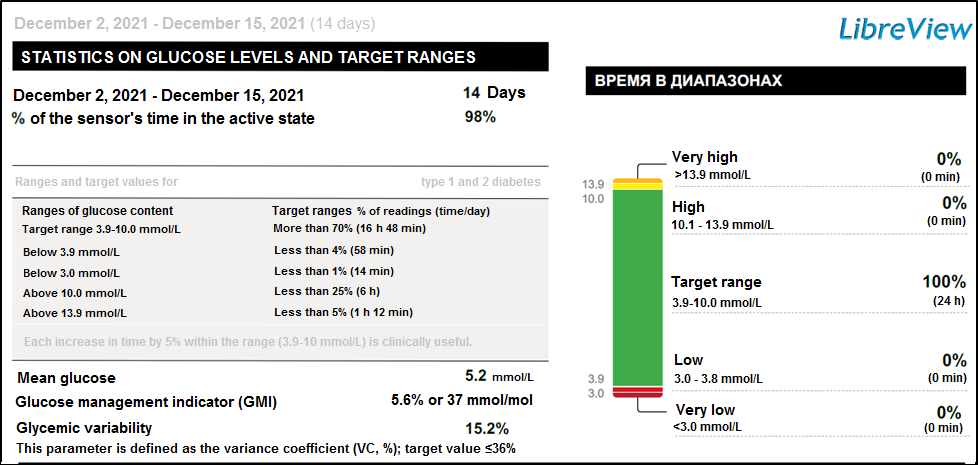
Fig. 5. OGP report, a man, athlete (transferring period of the training cycle), 20 years
Table 3 presents a comparative analysis of glycemic profile in the group of healthy volunteers compared to recommended GV values for patients with type 1 and 2 diabetes.
Table 3
Glycemic control key indicators in the examined groups if healthy volunteers compared to target glycemia ranges of the OGP protocol
|
Glycemic control indicators* |
OGP protocol values |
Group 1 |
Group 2 |
|
1. Time share (%), in which the data were accepted |
≥70 and more |
95-98 |
80-100 |
|
2. Mean glucose value, mmol/L |
4.1-6.1 |
5.1-5.2 |
4.4-5.7 |
|
3. Indicator of glycemic control, possible level of glycated hemoglobin (%) |
<6.5 |
5.5-5.6 |
5.2-5.8 |
|
4. Glycemic variability (%) |
<36 |
15.2-20.5 |
17.7-24.4 |
|
5. Time above the range >13.9 mmol/L (min, %) |
<5 (1 h 12 min) |
0 |
0
|
|
6. Time above the range 10.1–13.9 mmol/L (min, %) |
<25 (6 h) |
0 |
0
|
|
7. Time within the range 3.9–10.0 mmol/L (min, %) |
>70 (16 h 48 min)
|
91 (21 h 51 min) - 100% (24 h) |
66 (15 h 50 min) - 97 (23 h 17 min) |
|
8. Time below the range 3.0–3.8 mmol/L (min, %) |
<4 (58 min) |
0-6 (1 h 26 min) |
2 (29 min) - 29 (6 h 58 min) |
|
9. Time below the range <3.0 mmol/L (min, %) |
<1 (14 min) |
0-3 (43 min) |
1 (14 min) - 5 (1 h 12 min) |
Note: glycemia indicators in groups are presented in minimal and maximal values
In the non-athletes group, the indicator of time in target range was lower than target values, time of glucose values within the range of higher than 10.0 mmol/L was not found. Average glucose value, higher than reference values for children under 14 years of age (3.3-5.6 mmol/l), was revealed. The glycemic control and GV indicator remained within limits of target ranges. The average daily time spent in the 1 and 2 level hypoglycemia was higher than target values of OGP reports in the non-athletes group (29% versus 4% and 5% versus 1%). Therefore, the glycemic control analysis shows low values of glycemic variability in the athletes group and higher time of exposition in hypoglycemia in the non-athletes group compared to recommended values of the OGP report.
Main benefits of the examined parameters are the simplicity of calculation and absence of special requirements to the frequency and duration of glycemic control, the main disadvantage – limited informational capacity when evaluating GV in individuals with normal tolerance to glucose. These parameters do not consider frequency, duration and amplitude of glycemic fluctuations within reverence ranges of hypo-, hyper and normoglycemia in healthy people with different levels of physical activity.
We applied the graphic method of analyzing initial glycemic indicators obtained from the CGM data in order to conduct personalized evaluation of glucose homeostasis and metabolic flexibility in healthy people with different levels of physical activity. We calculated a percent ratio of time intervals in the state of hyper- normo- and hypoglycemia in all examined individuals. The generally accepted standard glucose range (4.1 to 6.1 mmol/L), accepted by WHO for people aged 14-60 years, was used as the reference range. Figure 6 shows cumulative graphs of time intervals of hyper-, normo- and hypoglycemia of healthy participants, showing a share of cases when glucose indicators (%) exceeded limits of the glycemic target range (4.0-6.0 mmol/L).
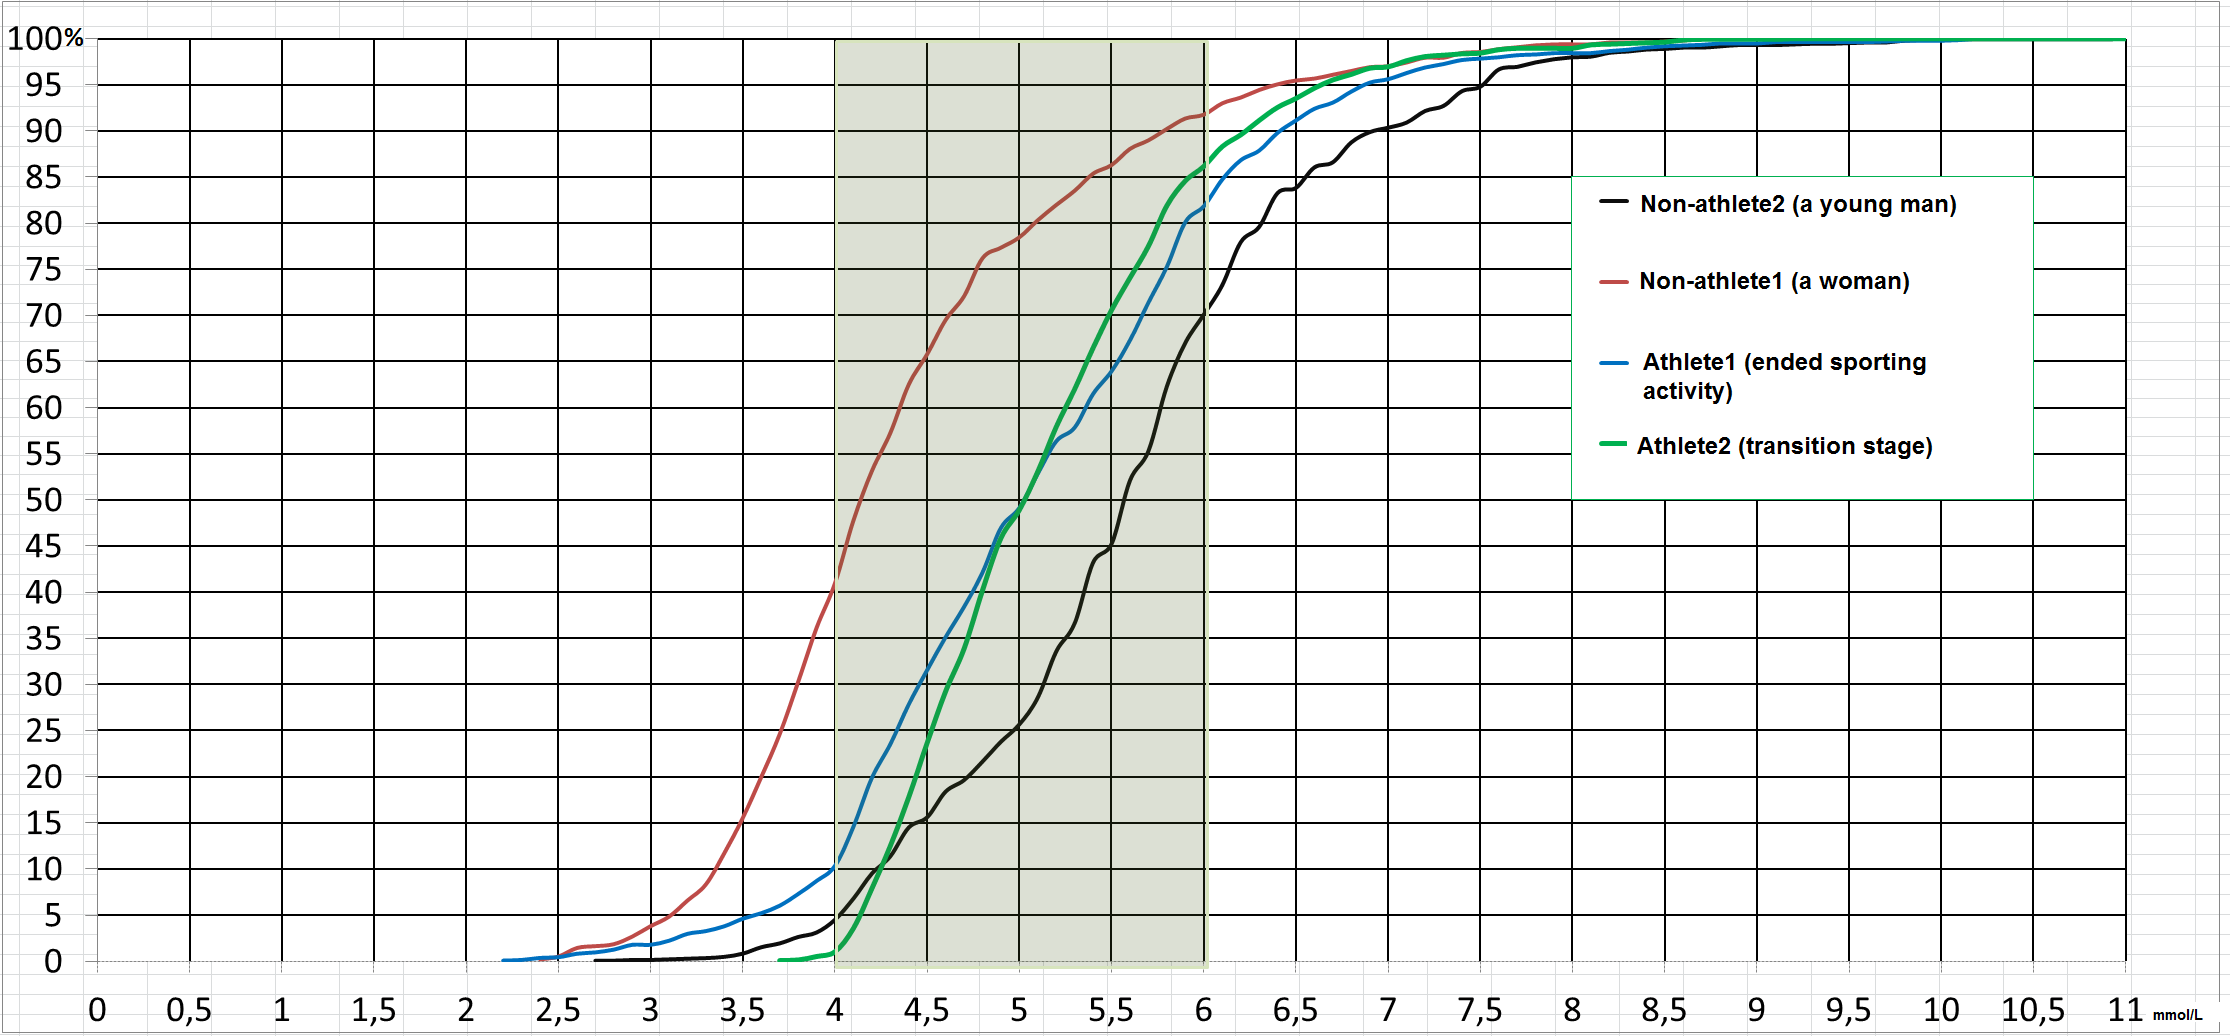
Fig. 6. Cumulative graph with distribution of glucose indicators, measured with CGM in four healthy participants
Note: light green line – reference glucose values
When measuring the target range of normoglycemia (compared to generally accepted clinical OGP protocols), we obtained following results: athlete 1 (PA – 1.9), time in hypoglycemic state – 10%, in euglycemic state – 72%, in hyperglycemic state – 18%, athlete 2 (PA – 2.2) – 1%, 85% and 14% respectively; non-athlete 1, a woman (PA – 1.4), time in hypoglycemic state – 40%, in euglycemic state – 52%, in hyperglycemic state – 8%; non-athlete 2, a young man (PA – 2.1) – 4%, 66% and 30% respectively. Thus, the least time spent in the euglycemic range (66%) was found in the non-athlete, a woman with the lowest level of physical activity. The most time spend in the normoglycemic state (84%) was found in the actual athlete during the transitioning stage of the training cycle.
The integral approach in evaluating glycemic risk of type 1 and 2 diabetes is implemented according to CGM parameters with the use of mean value and relative percentage contribution in the average-weighted evaluation from values of hypoglycemic, euglycemic and hyperglycemic ranges. Indicators of the CGM’s glycemic profile within clinical practice of high risk of diabetes correspond to following values (hypoglycemia %, euglycemia %, hyperglycemia %): type 1 diabetes (20%, 8%, 72%), type 2 diabetes (2%, 7%, 91%) [20]. Ranges of normo-, hyper- and hypoglycemia, received during the study, differ significantly from the average-weighted ratings of high risk of diabetes, obtained in clinical practice. Currently, there is no consensus regarding indicators of the normal glucose level in clinical practice. Moreover, many studies demonstrated that prolonging time of staying within the range of 4 to 6 mmol/L leads to an improvement in patient treatment outcomes [21-22]. Many studies also demonstrated linearly increasing risk of diabetes complications, related to an increase in time of staying within the hyperglycemia range, regardless of the diabetes state, with lower limits of the norm between 4 and 6 mmol/L [5, 22, 23, 24, 25].
Table 4
Mean value and standard deviation for glucose level indicators and glycemic variability within the group of Caucasian people and in general population of people without diabetes compared to the data from the study
|
|
Group/ethnicity |
Mann-Whitney p(3-1) |
|||
|
Glycemic variability indices |
Caucasian individuals (M±SD) n=44 |
General population (M±SD) n=70 |
Athletes (M±SD) n=2 |
Non-athletes (M±SD) n=2 |
|
|
Group number |
1 |
2 |
3 |
4 |
|
|
Age (years) |
27.3 (5.8) |
27.9 (5.2) |
21(0.4) |
18 (8.5) |
0.284 |
|
Mean glucose level (mmol/L) |
5.0 (0.5) |
5.1 (0.5) |
5.2 (1.14) |
5.0 (1.04) |
0.872 |
|
Mean standard deviation (mmol/L) |
1.5 (0.7) |
1.5 (0.7) |
0.88 (0.05) |
0.77 (0.08) |
0.319 |
|
CONGA (c.u.) |
4.4 (0.6) |
4.6 (0.5) |
4.6 (1.01) |
4.4 (0.93) |
0.865 |
|
LI (c.u.) |
0.4 (1.9) |
0.4 (2.2) |
2.0 (0.44) |
1.03 (0.22) |
0.412 |
|
J-Index (c.u.) |
13.7 (4.9) |
14.3 (4.7) |
13.09 (2.88) |
12.08 (2.54) |
0.914 |
|
LBGI (c.u.) |
3.5 (1.9) |
3.1 (1.9) |
2.9 (0.64) |
4.3 (0.90) |
0.764 |
|
HBGI (c.u.) |
0.4 (4.2) |
0.2 (3.8) |
1.0 (0.22) |
0.8 (0.17) |
0.886 |
|
GRADE (c.u.) |
0.4 (2.0) |
0.4 (2.1) |
0.5 (0.11) |
0.6 (0.13) |
0.960 |
|
MODD (c.u.) |
0.8 (1.3) |
0.8 (1.4) |
0.8 (0.18) |
0.8 (0.17) |
0.258 |
|
MAGE (c.u.) |
1.4 (0.5) |
1.4 (0.7) |
2.8 (0.32) |
1.5 (0.33) |
0.022 |
|
ADRR (c.u.) |
0.4 (4.5) |
5.5 (4.1) |
7.0 (1.54) |
2.9 (0.61) |
0.165 |
|
M-value (c.u.) |
5.5 (4.1) |
4.7 (3.8) |
4.9 (1.08) |
6.8 (1.36) |
0.888 |
|
MAG (c.u.) |
1.4 (0.3) |
1.3 (0.4) |
1.4 (0.31) |
1.5 (0.32) |
0.998 |
Note: CONGA – continuous overlapping net glucose index, LI – lability index, J-Index – mean amplitude of glycemic deviations, LBGI – low blood glucose index, HBGI – high blood glucose index, GRADE – glycemic risk assessment diabetes equation, MODD – mean of daily differences, MAGE – mean amplitude of glycemic excursions, ADRR – average daily risk range, M-value – index of blood glucose control, MAG – mean absolute glucose. Each parameter rates independently the whole range of glucose indicators during the CGM process for 14 days
We compared glycemic variability parameters in individuals with different level of PA with methods of non-parametric statistics (Mann-Whitney U-test for non-related groups and Wilcoxon T-test for related groups) with normal GV values obtained by a group of scientists from the Oxford Center for Diabetes, Endocrinology and Metabolism of the Churchill Hospital (table 4) [7]. As a reference group, we have chosen values of glycemic variability indicators in individuals of Caucasian race (44 people). We also analyzed GV values of general population of people participated in that study (70 people).
Mean values of glycemic excursion in athletes that exceed one standard deviation (the MAGE index) is statistically higher (Mann-Whitney U-test, p=0.022) (table 4) compared to healthy Caucasians. The MAGE index is a statistic measure of glycemic variability. It is used to evaluate quality of glycemic control in clinical practice. We have discovered a more pronounced mean amplitude of glucose fluctuations in athletes compared to normal values in the Caucasian group without diabetes. According to other parameters that evaluate GV, there were no statistically significant differences between studied groups and Caucasians.
Conclusion. The study of variability of physiological indicators demonstrating dynamics of adaptation and recovery of the body’s reserves is applied widely in sports, clinical, aerospace and preventive medicine. Methodological approaches of analyzing mechanisms of the homeostasis control on the level of humoral, autonomic and central links of the heart rate regulation were elaborately worked on based on the variational heart rate monitoring evaluation (R.M. Baevskij, 1979 г.). Ranges of the heart rate variability and their rating with the spectral analysis for various situations, including sports practice, were clearly described [26]. Currently, the sports practice demonstrates that decrease in the heart rate variability against the background of increasing heart rate frequency means less adaptation reserves and slower recovery processes in contrast to training loads [27]. Excessive blood pressure variability in clinical medicine is an unfavorable sign related to cardiovascular complications. In fact, physiological process that participate in short-term and long-term adaptation is described with the sinusoidal response, which, on the one hand, supports the implementation of certain potential, on the other hand – has an ability to restore it. Glucose metabolism is that basic energy-related process that ensures development of power and capacity of glycolytic mechanisms of the muscle activity’s energy support. The initial analysis of glycemic profiles in healthy volunteers demonstrated individual features of metabolic strategies of implementing glucose homeostasis in a body of an athlete and a non-athlete. Moreover, modern methodological approaches are aimed at predicting the development of diabetes and its complications within clinical range of glycemia. These indicators in healthy people, athletes with many reserves of glucose homeostasis, have limited value, because they do not indicate possible reserves and resources that are formed during sports activity. There is an urgent need in a new methodological approach of defining a special state of an athlete from the point of implementing glycemic homeostasis. The development of approaches for evaluating glycemic profile, based on statistic and geometric methods of analyzing frequency and amplitude indicators of CGM that characterize power of regulatory systems supporting glucose homeostasis and an ability to recover against the background of high energy expenditure, would serve as an informative tool for predicting influence of glycolytic loads on the carbohydrate status and its management.
REFERENCES
- Danne T. International Consensus on Use of Continuous Glucose Monitoring. Diabetes Сare, 2017, vol. 40, no. 12, pp. 1631–1640. DOI: 10.2337/dc17-1600.
- Klimontov V.V., Myakina N.E. Glycemic variability in diabetes mellitus. Novosibirsk: Novosibirsk National Research State University, 2016. 252 p. (in Russ.)
- Klimontov V.V. Influence of glycemic variability on the risk of cardiovascular complications in diabetes mellitus. Cardiology, 2018, vol. 58, no. 10, pp. 80–87. DOI: 10.18087/cardio.2018.10.10152. (in Russ.)
- Monnier L., Colette C., Owens D. Glucose variability and diabetes complications: Risk factor or biomarker? Can we disentangle the "Gordian Knot"? Diabetes Metab, 2021, vol. 47, no. 3, pp. 1012–1025. DOI: 10.1016/j.diabet.2021.101225.
- Organization, Definition and Diagnosis of Diabetes Mellitus and Intermediate Hyperglycemia. World Health Organization. Geneva, Switzerland, 2006. 50 p.
- American Diabetes Association. Diagnosis and classification of diabetesmellitus. Diabetes Care, 2010, no. 33 (Suppl. 1), pp. 62–69. DOI: 10.2337/dc10-S062.
- Hill N.R. Oliver N.S., Choudhary P., J.C Levy, Hindmarsh P., Matthews D.R. Normal reference range for mean tissue glucose and glycemic variability derived from continuous glucose monitoring for subjects without diabetes in different ethnic groups. Diabetes Technol. Ther., 2011, vol. 13, no. 9, pp. 921–928. DOI: 10.1089/dia.2010.0247.
- Semenova Yu.F. Indicators of glucose level variability and time spent in ranges in individuals with normal glucose tolerance according to the continuous monitoring data. Diabetes mellitus-2021: from monitoring to management: Materials of the IV Russian Interdisciplinary Scientific and Practical Conference with international participation. Novosibirsk, May 26-27, 2021. pp. 153–157. (in Russ.)
- Thomas F., Pretty C.G., Desaive T., Chase J.G. Blood Glucose Levels of Subelite Аthletes During 6 Days of Free Living. Diabetes Sci. Technol, 2016, vol. 10, no. 6, pp. 1335–1343. DOI: 10.1177/1932296816648344.
- Position of the American Dietetic Association, Dietitians of Canada, and the American College of Sports Medicine: Nutrition and Athletic performance // Journal of the American Dietetic Association, 2000, vol. 100, no. 12, pp. 1543–1556. DOI: 10.1016/S0002-8223(00)00428-4.
- Jacobs K.A, Sherman W.M. The efficacy of carbohydrate supplementation and chronic high-carbohydrate diets for improving endurance performance. Sport Nutr, 1999, vol. 9, no. 1, pp. 92–115.
- Borghouts L.B, Keizer H.A. Exercise and insulin sensitivity: a review. International journal of sports medicine, 2000, vol. 21, no. 1, pp. 1–12. DOI: 10.1055/s-2000-8847.
- Dzhandarova T.I., Mazevskaya Yu.S., Skotareva A.A. et al. Daily dynamics of adrenaline and norepinephrine content in the ventricular myocardium in rats under the influence of physical loads in changing environmental conditions. Current Directions of Fundamental and Applied Research: Materials of the XXVI International Scientific and Practical Conference, North Charleston, June 22-23, 2021. Morrisville: Lulu Press, Inc., 2021. pp. 6–9. (in Russ.)
- Bloom S.R. Differences in the metabolic and hormonal response to exercise between racing cyclists and untrained individuals. The Journal of physiology, 1976, vol. 258, no. 1, pp. 18. DOI: 10.1113/jphysiol.1976.sp011403.
- Ivy J.L. Muscle glycogen synthesis after exercise: effect of time of carbohydrate ingestion. Journal of applied physiology (Bethesda, Md.: 1985), 1988, vol. 64, no. 4, pp. 1480–1485. DOI: 10.1152/jappl.1988.64.4.1480.
- Marliss E.B., Vranic M. Intense exercise has unique effects on both insulin release and its roles in glucoregulation: implications for diabetes. Diabetes, 2002, no. 51 (suppl. 1), pp. 271–283.
- Black A.E. Critical evaluation of energy intake using the Goldberg cut-off for energy intake: basal metabolic rate. A practical guide to its calculation, use and limitations. International journal of obesity and related metabolic disorders: journal of the International Association for the Study of Obesity, 2000, vol. 24, no. 9, pp. 1119–1130. DOI: 10.1038/sj.
0801376. - Chernikova N.A. New possibilities in diabetes mellitus management using the Flash glucose monitoring. News. Opinions. Training, 2021, vol. 10, no. 3(36), pp. 88–94 DOI: 10.33029/2304-9529-2021-10-3-88-94. (in Russ.)
- Battelino T., Danne T., Bergenstal R.M., Amiel S.A. Clinical targets for continuous glucose monitoring data interpretation: Recommendations from the international consensus on time in range. Diabetes Care, 2019, no. (8), pp. 1593–603. DOI: https://doi.org/10.2337/dci19-0028.
- Hill N.R., N.R. Hill, Hindmarsh P.C., Stevens R.J. Method for assessing quality of control from glucose profiles. Diabet Med, 2007, vol. 24, no. 7, pp. 753–758. DOI: 10.1111/j.1464-5491.2007.x.
- Krinsley J.S. Effect of an intensive glucose management protocol on the mortality of critically ill adult patients. Mayo Clinic proceedings, 2004,
79, no. 8, pp. 992–1000. DOI: 10.4065/79.8.992. - Van den Berghe G., Wouters P., Weekers W. Intensive insulin therapy in the critically ill patients. Engl. J. Med, 2001, no. 345(19), pp. 1359–1367.
- Levitan E.B. Is nondiabetic hyperglycemia a risk factor for cardiovascular disease? A meta-analysis of prospective studies. Archives of internal medicine, 2004, vol. 164, no. 19, pp. 2147–2155. DOI:10.1001/archinte.164.19.2147.
- Nishida T., Tsuji S., Tsuji M. Oral glucose tolerance test predicts prognosis of patients with liver cirrhosis. J. Gastroenterol, 2006, vol. 101, no. 1, pp. 70–75.
- Tirosh A. Shai I., Tekes-Manova D. Normal fasting plasma glucose levels and type 2 diabetes in young men. Engl. J. Med, 2005, no. 353(14), pp. 1454–146
- Shlyk N.I., Lebedev E.S., Vershinina O.S. Evaluation of the quality of the training process in athletes based on express analysis of heart rate variability taking into account the individual type of regulation. Theory and Practice of Physical Culture, 2019, no. 2, pp. 18–20. (in Russ.)
- Kolomiets O.I., Bykov E.V., Petrushkina N.P. Analysis of the quality of recovery of athletes based on Firstbeat monitoring (heart rate variability). Scientific and Sports Bulletin of the Urals and Siberia, 2019, no. 3(23), pp. 3–13. (in Russ.)
INFORMATION ABOUT THE AUTHORS:
Anastasia Yur'evna Khrebtova – Candidate of Biological Sciences, Associate Professor of the Biochemistry Department, Ural State University of Physical Culture, Chelyabinsk, e-mail:
Evgenij Vital’evich Bykov – Doctor of Medical Sciences, Professor, Head of the Department of Sports Medicine and Physical Rehabilitation, Research Activity Vice-Rector, South Ural State Medical University, Chelyabinsk, e-mail:
Anatolij Ivanovich Kuzin – Doctor of Medical Sciences, Professor, Head of the Department of Therapy, Clinical Pharmacology with the course of Endocrinology and Nutrition of the Advanced Professional Education Institute, South Ural State Medical University, Chelyabinsk, e-mail:
Ol’ga Viktorovna Kamerer – Candidate of Medical Sciences, Associate Professor of the Department of Therapy, Clinical Pharmacology with the course of Endocrinology and Nutrition of the Advanced Professional Education Institute, South Ural State Medical University, Chelyabinsk, e-mail:
For citation: Khrebtova A.Yu., Bуkov E.V., Kuzin A.I., Kamerer O.V. Methodological approaches of glycemic control in sports practice based on continuous glucose monitoring data. Russian Journal of Sports Science: Medicine, Physiology, Training, 2022, vol. 1, no. 1. DOI: 10.51871/2782-6570_2022_01_01_8