


Download the article in pdf format
Publication date: 01.12.2022
DOI: 10.51871/2782-6570_2022_01_04_4
UDC 616.633.495.9; 542.934
DYNAMICS OF WATER CHANGES IN THE BODY DURING WEEKLY INTAKE OF CREATINE SUPPLEMENTS: A PILOT STUDY
A.V. Meshtel’, A.B. Miroshnikov
Russian State University of Physical Culture, Sport, Youth and Tourism, Moscow, Russia
Annotation. The purpose of the research is to study the dynamics of fluid changes in the body during a weekly course of creatine intake. The study was conducted in the Russian State University of Physical Culture, Sport, Youth and Tourism and included male participants (n=8, age – 26±4.1 years). The fluid level was measured using a bioimpedance analyzer of body composition. The participants took 0.07 g of creatine per 1 kg of body mass daily, and came to the laboratory daily to measure body mass and composition. Statistical analysis was carried out using the Wilcoxon T-test and the Statistica 10 package (StatSoft, USA). The differences were considered significant at p<0.05. It was found that the fluid when taking creatine changes in waves – the peak is reached on the 2nd and 5th day of intake, a slight decline occurs on the 4th day, and by the 7th day the body's fluid level returns to normal.
Keywords: creatine, body hydration, intracellular water, total body water, creatine monohydrate supplements.
Introduction. One of the main problem of applying creatine supplements in sports is the oncotic effect of creatine. Despite the abundance of studies that praise creatine as a supplement for its accessibility, safety [1-4] and efficiency [5-10], the athletes have to avoid its intake during competitions due to its strong effect on the body hydration level. However, there is currently no data on what point the fluid level reaches its peak and at what level it declines. The dynamics of fluid changes are rarely shown in studies. For example, Kresta et al took data from the first day, after a week and after three weeks [11], which gives us some ideas on dynamics. However, there is no research that is fully dedicated to the examination of such phenomenon.
Therefore, the purpose of this pilot study is to examine the dynamics of changes in the body hydration level during a weekly course of creatine intake.
Methods and organization. The study took place in the Russian State University of Physical Education, Sport, Youth and Tourism on August 2022.
Participants. The study involved healthy men aged 21 to 30 years (n=8, age – 26±4.1 years), body length – 181±4.6 cm. They were included in the study if they had not taken creatine or diuretics for the last month. At the beginning, the test subjects signed papers on voluntary participation in the experiment.
Equipment. The participants visited the university every day to measure body mass and composition. Evaluation of body composition was made with the MEDASS AVS-01 bioimpedance analyzer (Russia) and the FIAB 22х34 mm disposable film electrodes (Italy). To measure the body mass, we used the Vitek VT-8078 floor scales (China). Before the study, the participants were given directions that correspond with guidelines described in the MEDASS AVS-01 manual: the measurements were carried out two hours after food intake; during the week, the participants restrained from intense physical activity and alcohol. We measured body mass, Total Body Water (TBW) and Extracellular Water (ECW). Intercellular Water (ICW) was calculated according to the following formula: ICW = TBW - ECW (l).
Diet and creatine intake. During the study, the participants followed the isocaloric diet, all calculations were made by them with the FatSecret app (USA). After the initial measurements, we calculated creatine doses and gave them in personal portion packers. Each morning, the participants took 0.07 g of creatine per 1 kg of body mass (R-Line Nutrition, Russia), which amounted to approximately 5.9±0.8 g of creatine per day, mixed with 300 ml of water.
Statistical analysis. The statistical characteristics of scale variables were presented as arithmetic means and standard deviations in form of numbers. The statistical significance of differences in the group between days was checked with the Wilcoxon’s t-test. All calculations were made with the Statistica 10 software package (StatSoft, USA). The significance level was deemed as significant if p<0.05.
Results and discussion. The initial measurement results are presented in table 1. As a result of weekly study, we have received data presented in table 2.
The results are presented more clearly in the diagram of the dynamics of changes in body mass (fig. 1) and body fluids (fig. 2, 3, 4).
Table 1
Initial results
|
Body mass, kg |
Lean body mass, kg |
TBW, l |
ECW, l |
ICW, l |
|
80.7±9.1 |
65±4.6 |
47.8±3.3 |
18.6±1.3 |
29.2±2 |
Note: TBW – Total Body Water, ECW – Extracellular Water, ICW – Intracellular Water
Table 2
Results of weekly creatine intake
|
Indicators |
Days (mean value±standard deviation) |
||||||
|
Day 1 |
Day 2 |
Day 3 |
Day 4 |
Day 5 |
Day 6 |
Day 7 |
|
|
Body mass, kg |
80.7±9.1 |
81±9∗• |
81.2±9.2 |
80.4±8.7• |
80.6±9 |
80.1±8.7∗ |
80±8.6∗ |
|
TBW, l |
47.8±4.2 |
48.6±4,6• |
48.8±3.3∗ |
48.6±4.1∗ |
49.1±3.6∗ |
47.8±3.1• |
47.8±3.7 |
|
ECW, l |
18.6±1.6 |
18.9±2.1 |
18.5±1.6 |
18.8±1.6• |
18.7±1.4 |
18.3±1.3∗• |
18.5±1.5 |
|
ICW, l |
29.2±2.6 |
29.8±2.7∗• |
30.3±1.9∗ |
29.8±2.5∗ |
30.4±2.6∗ |
29.5±1.9∗ |
29.3±2.2 |
Note: ∗ – significant differences with initial measurements (p<0.05); • – significant differences with the previous day (p<0.05), TBW – Total Body Water; ECW – Extracellular Water; ICW – Intracellular Water
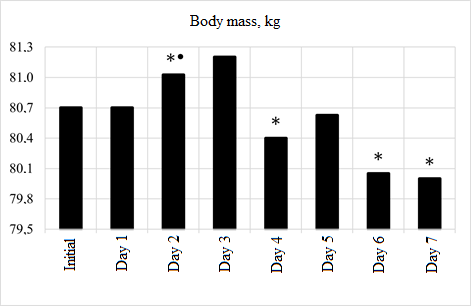
Fig. 1. Dynamics of changes in body mass
Note: ∗ – significant differences with initial measurements (p<0.05); • – significant differences with the previous day (p<0,05)
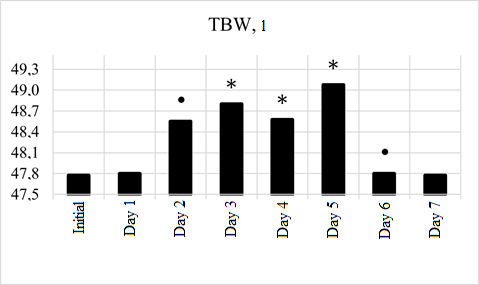
Fig. 2. Dynamics of changes in TBW
Note: ∗ – significant differences with initial measurements (p<0.05); • – significant differences with the previous day (p<0.05); TBW – Total Body Water
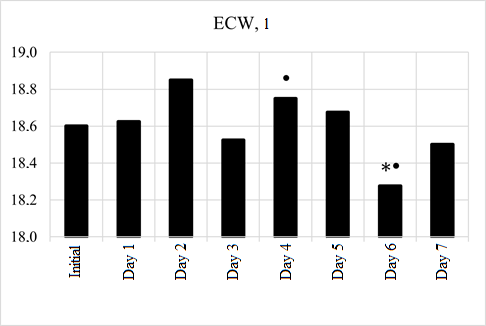
Fig. 3. Dynamics of changes in ECW
Note: ∗ – significant differences with initial measurements (p<0.05); • – significant differences with the previous day (p<0.05); ECW – Extracellular Water
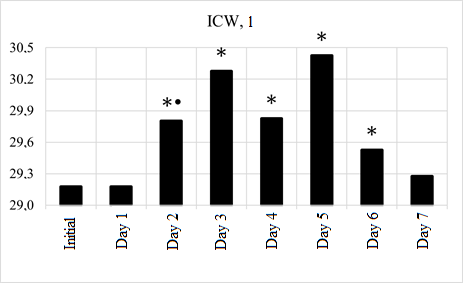
Fig. 4. Dynamics of changes in ICW
Note: ∗ – significant differences with initial measurements (p<0.05); • – significant differences with the previous day (p<0.05); ICW – Intracellular Water
The participants did not report any side or adverse effects after creatine intake during and after the study.
The receipt of initial results of the experiments can be considered as a feature of this study. After changes, all indicators returned to the level that was before the experiment, or dropped below this value. The data from other studies demonstrate an increased level of fluid even a month after creatine intake [11-12]. This fact suggests that changes in the body fluids after creatine intake occur in waves.
Significant changes in the body fluids begin after a second day of creatine intake: body mass starts to grow, the TBW level increases by ~0.8 l, ICW – by 0.6 l, а ECW – by 0.3 l, reaching their peak values in 18.9±2.1 l. On the third day, the TBW, ICW and body mass levels reach their first peak. Then, on the fifth day, the second peak of TBW and ICW occurs, but body mass values are closer to their initial value. Between the third and the fifth day, we have registered a decline in the body fluid and mass levels. It suggests that the fourth and the seventh day can be favorable for weigh-in, during the first week of creatine intake. Differences in the ICW were significant in comparison with the initial measurements (p<0.05) all the time from the second till the sixth day. During the second day, we have registered a rapid growth compared to the first day.
What we find interesting that the TBW and ICV values change the most, while ECW does not change much during the whole experiment. The ECW fluctuations amount to just 0.6 l on average. It grown significantly on the fourth day, relatively – on the third day and on the sixth day compared to the initial measurement and the fifth day. This result correspond with the data discovered by other authors [13-14], who also noted that creatine just slightly influences extracellular water increasing the intracellular water volume. A significant decline of the ECW on the sixth day corresponds with the results obtained by Brilla et al, who also registered the decline, but in case of one-time measurement only [15].
We also would like to note a decline in the TBW, ICW and body mass on the fourth day and rapid decline of all indicators on the sixth day. To explain this, further studies are required.
Conclusion. The obtained results have shown that changes in the body fluids related to creatine intake do not occur linearly, but in waves, if we look as the week profile of the creatine course. The peak is reached on the 2nd and 5th days, a slight decline – on the 4th day. By day 7, the body fluids level returns to normal.
These results can assist when developing creatine dosage regiments that would contribute of lower fluid retention. Further studies will include more participants and take more time. Furthermore, other studies should include other creatine dosage regiments, different doses in order to evaluate the amount of creatine taken on the body hydration level.
REFERENCES
- Kim H.J., Kim C.K., Carpentier A., Poortmans J.R. Studies on the safety of creatine supplementation. Amino Acids, 2011, 40, no. 5, pp. 1409-1418. DOI: 10.1007/s00726-011-0878-2.
- Balestrino M., Adriano E. Beyond sports: Efficacy and safety of creatine supplementation in pathological or paraphysiological conditions of brain and muscle. Med Res Rev, 2019, vol. 39, no. 6, pp. 2427-2459. DOI: 10.1002/med.21590.
- Jäger R., Purpura M., Shao A., Inoue T., Kreider R.B. Analysis of the efficacy, safety, and regulatory status of novel forms of creatine. Amino Acids, 2011, vol. 40, no. 5, pp. 1369-1383. DOI: 10.1007/s00726-011-0874-6.
- Almeida D., Colombini A., Machado M. Creatine supplementation improves performance, but is it safe? Double-blind placebo-controlled study. J Sports Med Phys Fitness, 2020, vol. 60, no. 7, pp. 1034-1039. DOI: 10.23736/S0022-4707.20.10437-7.
- Wang C.C., Fang C.C., Lee Y.H., Yang M.T., Chan K.H. Effects of 4-Week Creatine Supplementation Combined with Complex Training on Muscle Damage and Sport Performance. Nutrients, 2018, vol. 10, no. 11, p. 1640. DOI: 10.3390/nu10111640.
- Dos Santos E.E.P., de Araújo R.C., Candow D.G., Forbes S.C., Guijo J.A., de Almeida Santana C.C., Prado W.L.D., Botero J.P. Efficacy of Creatine Supplementation Combined with Resistance Training on Muscle Strength and Muscle Mass in Older Females: A Systematic Review and Meta-Analysis. Nutrients, 2021, vol. 13, no. 11, p. 3757. DOI: 10.3390/nu13113757.
- Lanhers C., Pereira B., Naughton G., Trousselard M., Lesage F.X., Dutheil F. Creatine Supplementation and Upper Limb Strength Performance: A Systematic Review and Meta-Analysis. Sports Med, 2017, vol. 47, no. 1, pp. 163-173. DOI: 10.1007/s40279-016-0571-4.
- Kaviani M., Abassi A., Chilibeck P.D. Creatine monohydrate supplementation during eight weeks of progressive resistance training increases strength in as little as two weeks without reducing markers of muscle damage. J Sports Med Phys Fitness, 2019, vol. 59, no. 4, pp. 608-612. DOI: 10.23736/S0022-4707.18.08406-2.
- Candow D.G., Chilibeck P.D., Gordon J., Vogt E., Landeryou T., Kaviani M., Paus-Jensen L. Effect of 12 months of creatine supplementation and whole-body resistance training on measures of bone, muscle and strength in older males. Nutr Health, 2021, vol. 27, no. 2, pp. 151-159. DOI: 10.1177/0260106020975247. Epub 2020 Nov 24. PMID: 33234019.
- Mills S., Candow D.G., Forbes S.C., Neary J.P., Ormsbee M.J., Antonio J. Effects of Creatine Supplementation during Resistance Training Sessions in Physically Active Young Adults. Nutrients, 2020, vol. 12, no. 6, p. 1880. DOI: 10.3390/nu12061880.
- Kresta J.Y., Oliver J.M., Jagim A.R., Fluckey J., Riechman S., Kelly K., Meininger C., Mertens-Talcott S.U., Rasmussen C., Kreider R.B. Effects of 28 days of beta-alanine and creatine supplementation on muscle carnosine, body composition and exercise performance in recreationally active females. J Int Soc Sports Nutr, 2014, vol. 11, no. 1, p. 55.
- Francaux M., Poortmans J.R. Effects of training and creatine supplement on muscle strength and body mass. Eur J Appl Physiol Occup Physiol, 2013, vol. 80, no. 2, pp. 165-168.
- Ribeiro A.S., Avelar A., Kassiano W., Nunes J.P., Schoenfeld B.J., Aguiar A.F., Trindade M.C.C., Silva A.M., Sardinha L.B., Cyrino E.S. Creatine Supplementation Does Not Influence the Ratio Between Intracellular Water and Skeletal Muscle Mass in Resistance-Trained Men. Int J Sport Nutr Exerc Metab, 2020, vol. 11, pp. 1-7. DOI: 10.1123/ijsnem.2020-0080.
- Deminice R., Rosa F.T., Pfrimer K., Ferrioli E., Jordao A.A., Freitas E. Creatine Supplementation Increases Total Body Water in Soccer Players: a Deuterium Oxide Dilution Study. Int J Sports Med, 2016, vol. 37, no. 2, pp. 149-153. DOI: 10.1055/s-0035-1559690.
- Brilla L.R., Giroux M.S., Taylor A., Knutzen K.M. Magnesium-creatine supplementation effects on body water. Metabolism, 2003, vol. 52, no. 9, pp. 1136-1140. DOI: 10.1016/s0026-0495(03)00188-4.
INFORMATION ABOUT THE AUTHORS:
Aleksandr Vital’evich Meshtel’ – Master’s Student of the Department of Sports Medicine, Russian State University of Physical Culture, Sport, Youth and Tourism, Moscow, e-mail:
Aleksandr Borisovich Miroshnikov – Candidate of Biological Sciences, Associate Professor of the Department of Sports Medicine, Russian State University of Physical Culture, Sport, Youth and Tourism, Moscow, e-mail:
For citation: Meshtel’ A.V., Miroshnikov A.B. Dynamics of water changes in the body during weekly intake of creatine supplements: a pilot study. Russian Journal of Sports Science: Medicine, Physiology, Training, 2022, vol. 1, no. 3. DOI: 10.51871/2782-6570_2022_01_04_4