


Download the article in pdf format
Publication date: 15.03.2025
DOI: 10.24412/2782-6570-2025_04_01_2
UDC 004.89
ANALYSIS OF THE FUNCTIONAL STATE OF ATHLETES AND NON-ATHLETES BY MACHINE LEARNING METHODS
R.M. Khusnutdinoff1,2, A.M. Sitdikov2, M.I. Galyautdinov2, L.M. Akhmetshina3,4
1Kazan State Power Engineering University, Kazan, Russia
2Volga Region State University of Physical Culture, Sports and Tourism, Kazan, Russia
3Interregional Clinical Diagnostic Center, Kazan, Russia
4Zelenodolsk Central District Hospital, Zelenodolsk, Russia
Abstract. The aim of the study – a comparative analysis of the functional state of athletes and non-athletes using machine learning methods. The input factors were experimental data on the physiological parameters and characteristics of the subjects obtained at the research center of the Volga Region State University of Physical Culture, Sport and Tourism. The selection of significant factors was carried out using the principal component analysis method. A detailed analysis of the experimental data was performed using artificial neural network and random forest models, for which optimal configurations and hyperparameter values were found. It was found that both methods allow identifying athletes and non-athletes by their physiological parameters and characteristics with a high degree of probability (over 90%).
Keywords: principal component analysis, artificial neural network, random forest method, functional state.
Introduction. In a modern world data mining methods come into broader use in different fields of human activity. For example, machine learning methods allow processing and analyzing vast volumes of data, find regulations and construct predictions, sometimes impossible for a human. In addition, artificial intelligence systems possess such important properties as self-learning and making autonomous decisions based on data without any obvious human assistance or program task. Currently, one of the most widely used applications of artificial intelligence is its implementation in description, prediction, classification and interpretation of complex data sets. In particular, such methods are used in medicine for diagnosis and analysis, as well as for making effective decisions [1]. In sports, this technology changes analytics, suggesting more detailed and precise understanding of each aspect of sports results [2]. Machine learning allows conducting a comprehensive analysis exceeding the possibilities of traditional methods.
The aim of the study is a comparative analysis a comparative analysis of the functional state of athletes and non-athletes using machine learning methods.
Methods and organization. To discover peculiarities of the functional state of different test subject groups (athletes and non-athletes), we used two supervised machine learning methods based on the experimental data: artificial neural network and random forest. The fully connected multilayer neural network consisted of four layers (input, two hidden ones and an output). An input layer included 11 neurons, where the parameters of the subjects characterizing the functional state and one noise parameter were taken as input. The first and second hidden layers included 32 and 64 neurons respectively. The brute force method identified hyperparameters that provide the model with the highest prediction accuracy and optimal values of weights. We also used the stochastic gradient descent [3] with splitting into minibatches of 10 training samples each and learning rate coefficient γ=0.001. Elementary thunks of this network that included input and hidden layer had a non-linear activation function ReLU (Rectified Linear Unit) while at the same time the output layer signal was transformed with the Softmax function. The root mean square error between the exact and predicted values was calculated to estimate the loss function at each iteration. The data set was divided into training and test sample in the ratio of 50/50%. The quality criterion – cross-entropy – was used to evaluate the model performance on the test sample.
As a second method of machine learning, we used the random forest method suggested by Leo Breiman and Adele Cutler [4]. The algorithm is used for classification, regression and clustering tasks. The main idea includes applying a multitude of decision trees, which combines the Breiman’s “bagging” method and a random subspace method. In this study, we carried out learning of a number of random forest models with a different number of trees. We have found that 10 trees are enough for a stable operation of the algorithm.
The experimental data included a data set consisting of physiological parameters and characteristics of tests subjects of both genders aged 10 to 27 years: age, maximal oxygen consumption (MOC), physical activity (hours/week), weight (kg), fat tissue mass (kg), muscle mass (kg), bone tissue mass (kg), protein, body mass index (BMI), body water (kg); parameters defining basal metabolism; one noise parameter, generated by a random number generator. The latter was used to test the stability of the predictive ability of machine learning methods. Two groups of subjects participated in the research: experimental (126 people or 82.89% of the total number of subjects) and control (26 people, 17.11%). The experimental group included athletes professionally engaged in certain sports (track-and-field, rhythmic gymnastics, badminton, tennis, soccer, volleyball, wrestling, martial arts, rowing, canoeing, swimming, etc.), as well as those who had sports titles and ranks. The control group consisted of young, healthy people engaged in moderate physical activity from 2 to 10 hours per week. All studies were conducted at the research centre of the Volga Region State University of Physical Culture, Sports and Tourism [5].
Results and discussion. At a beginner stage of the experimental analysis data analysis, we have calculated the Pearson correlation matrix between various parameters and characteristics of the subjects (fig. 1). It can be seen that a number of inherent physiological parameters have a strong correlation, such as physical activity and muscle tissue mass, body water and bone tissue mass etc. In order to reveal significant factors, we have performed the data dimensionality reduction with the principal component analysis method (fig. 2). Since all input parameters are described with different values and value ranges, we have performed a calibration procedure as a preliminary data processing in such way that the input parameter values were within the [0;1] range.
It is evident from the cumulative percent value of the explained variance (left column of the fig. 2) that four principal components explain 94.4% of the variance (at the recommended 60% variance). The first component explains 60.8% of the variance corresponding with 11 variables; the second – 22.9%; the third – 6.0%; the fourth – 4.66%. The right column of the figure 2 shows distribution of the experimental data for athletes and non-athletes in the plane of the first
two components. As we can see, this diagram has two clusters: cluster with a compact distribution of points at negative values of the first principal component that characterizes the data of the control group, while the cluster with a scattered distribution of points in the area of positive values of the first principal component characterizes the data of the experimental group.
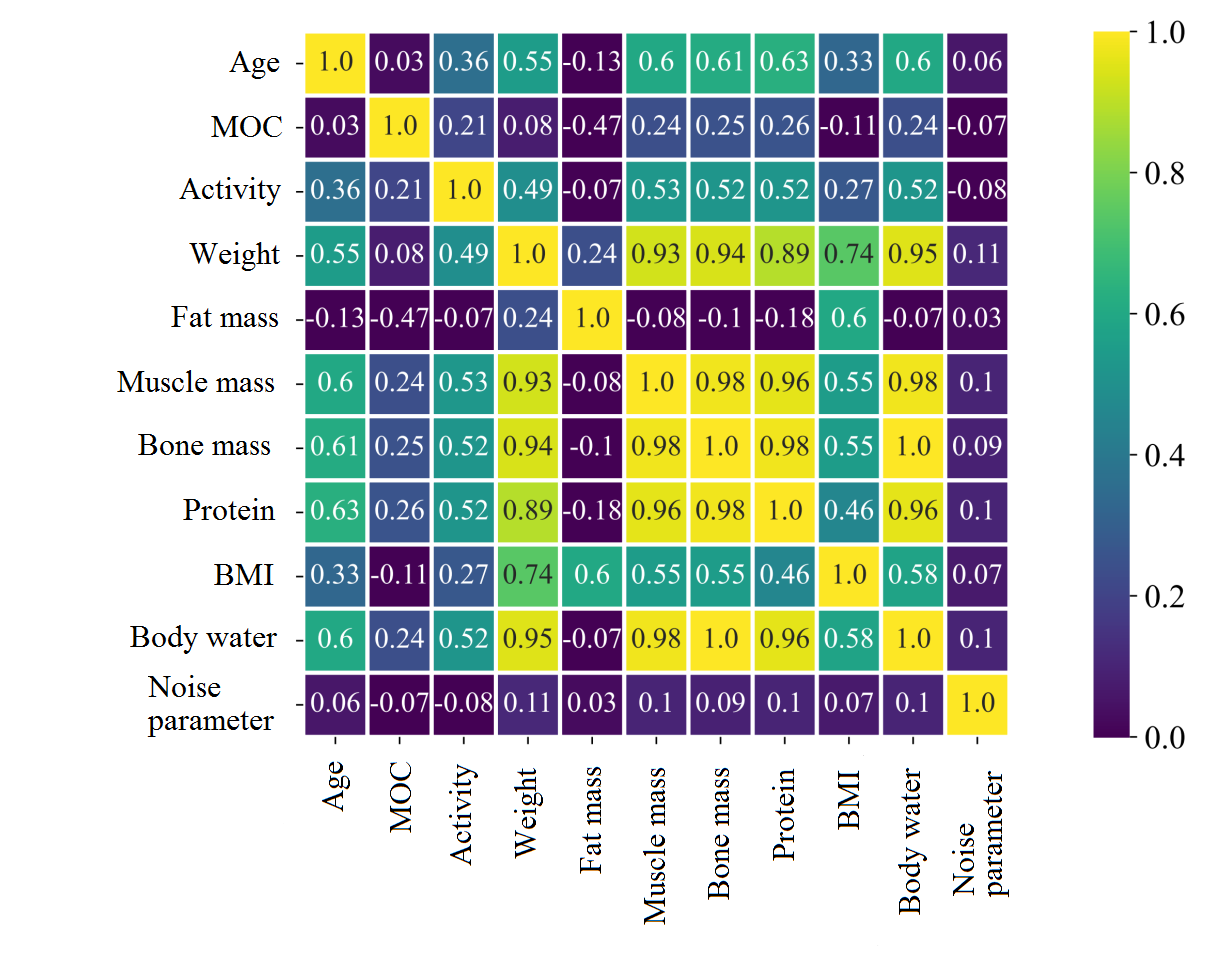
Fig. 1. The Pearson correlation matrix for the examined parameters
Taking into account the performed data preprocessing, we have built the artificial neural network model. The figure 3 demonstrated loss function (a) and model accuracy (b) as a function of iteration index. As can be seen from the figure, the model accuracy on the training sample was more than 93%.
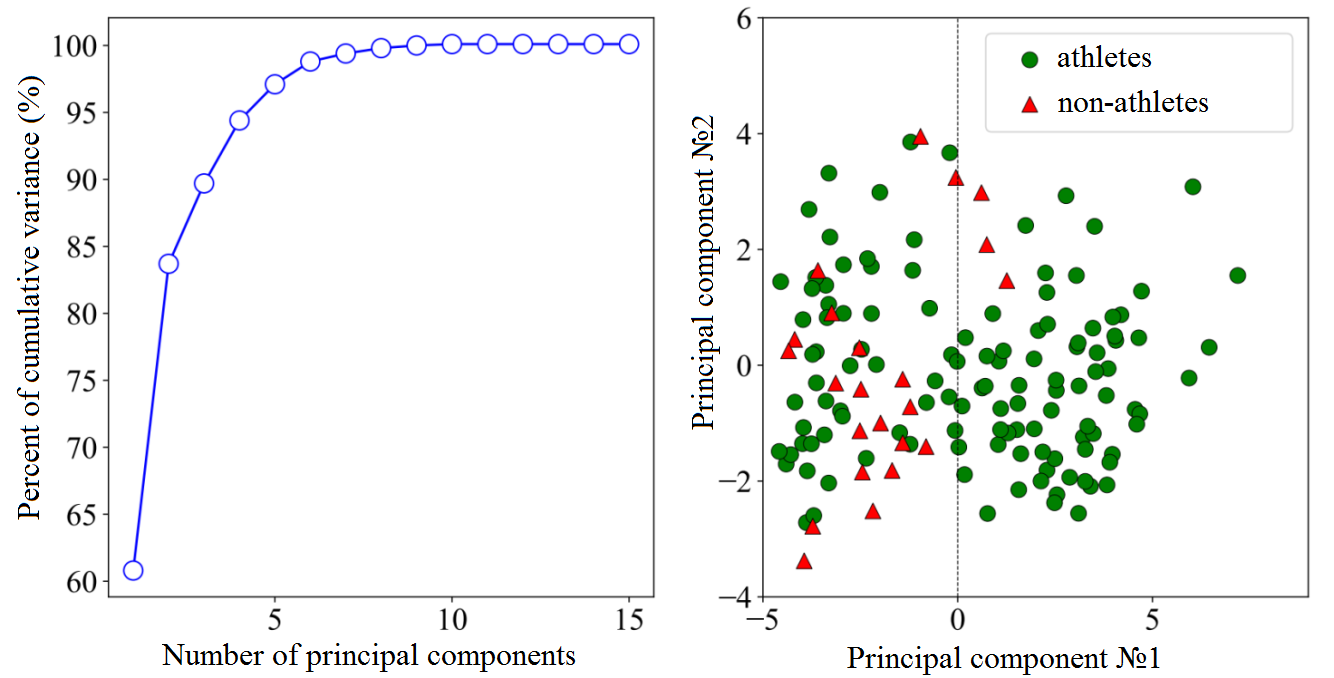
Fig. 2. The principal component analysis: cumulative dispersion percentage depending on a number of principal components (left column); data distribution in experimental (circles) and control (triangles) groups in the plane of the first two components (right column)
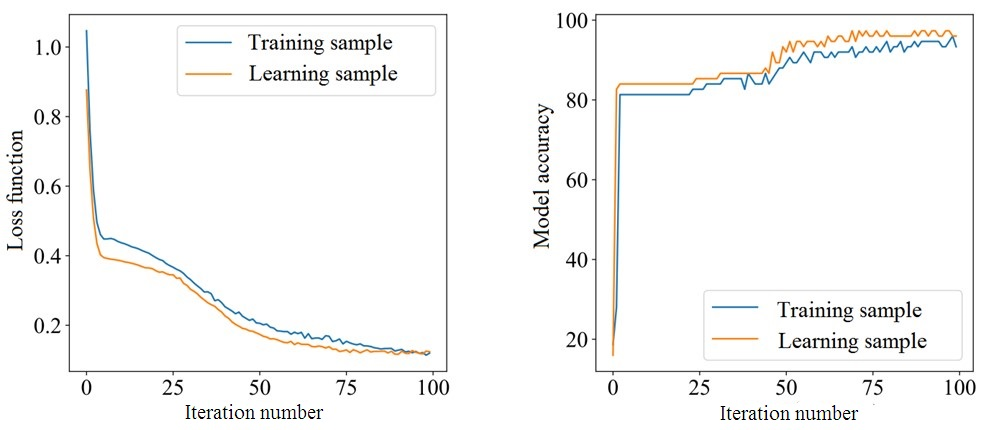
Fig. 3. Loss function (left column) and model accuracy (right column) as a function of iteration number
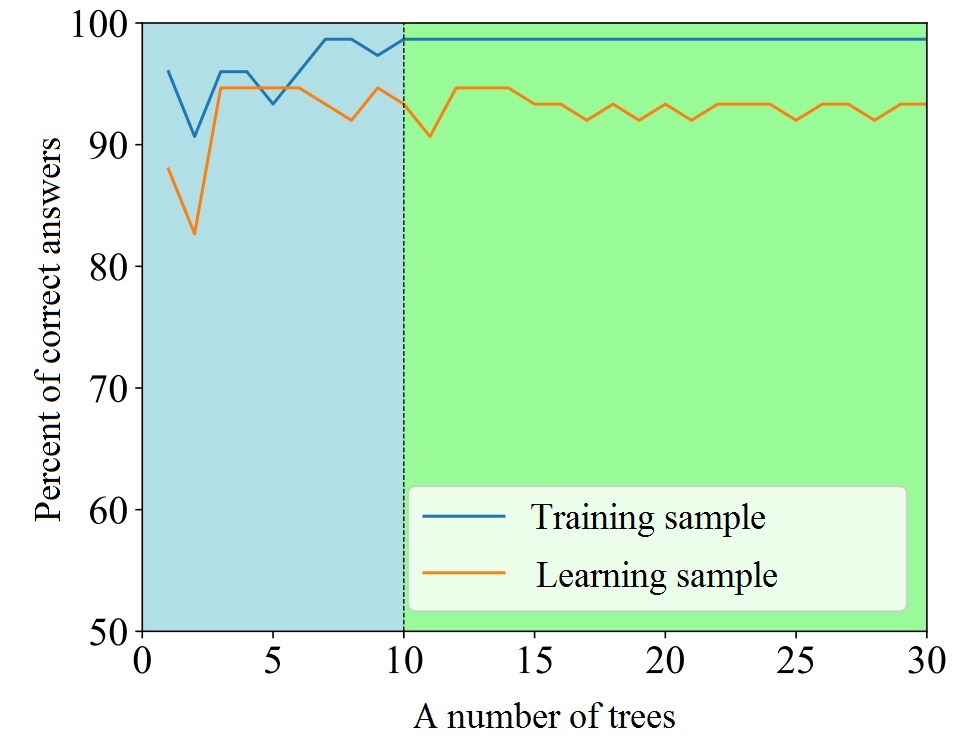
Fig. 4. Number of correct answers depending on a number of trees
The second stage of our study was an application of the random forest method (a multitude of decision trees used for classification and regression) in the experimental data analysis. We performed training of several random forest models with a different number of trees (fig. 4). As it seen from the figure, the percent of correct answers on the training sample reaches a plateau at value of 10 trees, which indicates stable operation of the algorithm at a minimum number of trees (N=10). Figure 5 shows a comparison of the predictive ability of two machine learning methods: the presented artificial neural network model and the random forest model with 10 trees. Both methods lead to the same results, namely, they allow to identify athletes and non-athletes by their physiological parameters and characteristics with high probability (over 90%).
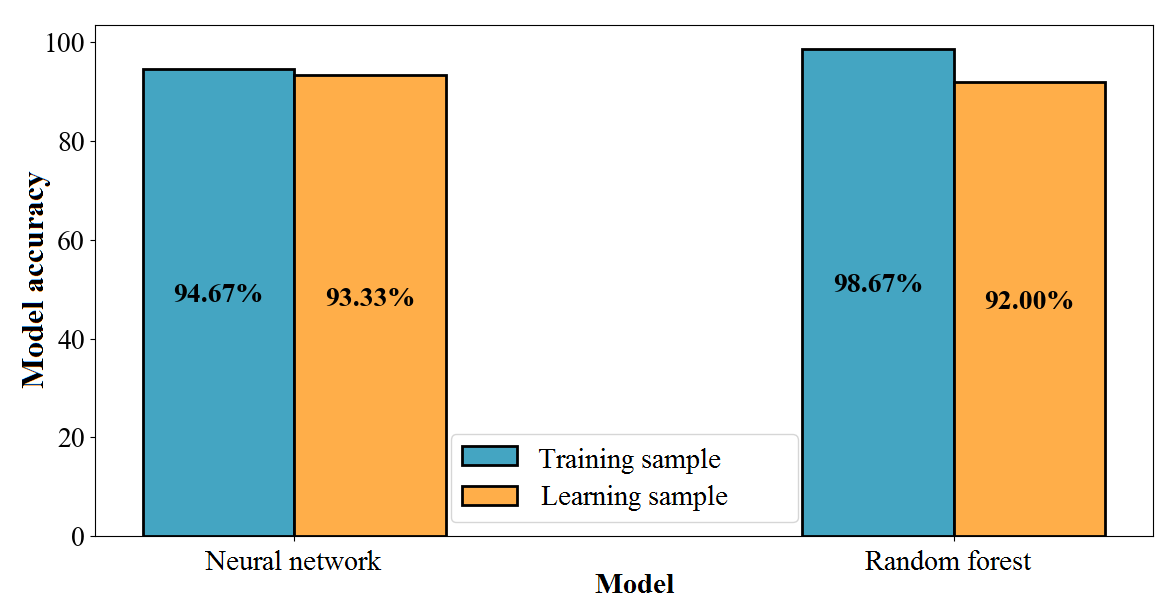
Fig. 5. Comparing the predictive ability of two machine learning methods: the artificial neural network model and the random forest model
Conclusion. We have conducted a systematic study of the functional state of athletes and non-athletes with two machine learning methods: the artificial neural network model and the random forest model. As input factors we used the experimental data on physiological parameters and characteristics of the test subjects. The significant factor selection was done with the principal component analysis method. We have wound that four principal components explain 94.4% of the variance (at the recommended 60% variance). For artificial neural network and random forest models, we have discovered optimal configurations and hyperparameter values. We have also found that both methods allow identifying athletes and non-athletes by their physiological parameters and characteristics with high probability (over 90%).
We have developed artificial neural network and random forest models, which allow defining the functional state of test subjects by a set of physiological parameters and identifying them as athletes and non-athletes (young, healthy people engaged in moderate physical activity).
Conflict of interest. The authors declare no conflict of interest.
REFERENCES
- Gift N. Pragmatic AI. Machine learning and cloud technologies: scientific. ed. Trans. from English by I. Palti. St. Petersburg: Piter, 2019, 300 p. (in Russ.)
- Vasil’ev A.N., Tarkhov D.A. Neural network modeling. Principles. Algorithms. Applications. St. Petersburg: Publishing house of the Polytechnic University, 2009, 527 p. (in Russ.)
- Khajkin S. Neural networks: a complete course. 2nd ed. Moscow: Williams, 2006. 1104 p. (in Russ.)
- Breiman L. Random Forests. Machine Learning, 2001, vol. 45, pp. 5–32.
- Khusnutdinoff R.M., Sitdikov A.M., Fatkulov I.R., Galyautdinov M.I., Akhmetshina L.M. Comparative analysis of the functional state of the body of athletes and non-athletes according to anthropometry, morphology and BMD. Scientific Notes of the P.F. Lesgaft University, 2023, no. 12, pp. 208–213. (in Russ.)
INFORMATION ABOUT THE AUTHORS:
Ramil M. Khusnutdinoff – Candidate of Physical and Mathematical Sciences, Associate Professor of the Department of Information Technologies and Intelligent Systems, Kazan State Power Engineering University; Associate Professor of the Department of Information Systems and Phygital Sports, Volga Region State University of Physical Culture, Sports and Tourism, Kazan, e-mail:
Almaz M. Sitdikov – Senior Lecturer of the Department of Information Systems and Phygital Sports, Volga Region State University of Physical Culture, Sports and Tourism, Kazan, e-mail:
Marat I. Galyautdinov – Candidate of Physical and Mathematical Sciences, Associate Professor of the Department of Information Systems and Phygital Sports, Volga Region State University of Physical Culture, Sports and Tourism, Russia, Kazan, e-mail:
Liliya M. Akhmetshina – Cardiologist, Interregional Clinical Diagnostic Center, Kazan; General Practitioner, Zelenodolsk Central District Hospital, Zelenodolsk, e-mail:
For citation: Khusnutdinoff R.M., Sitdikov A.M., Galyautdinov M.I., Akhmetshina L.M. Analysis of the functional state of athletes and non-athletes by machine learning methods. Russian Journal of Sports Science: Medicine, Physiology, Training, 2025, vol. 4, no. 1(13). DOI: 10.24412/2782-6570-2025_04_01_2